第6回:データの可視化
2024-05-14
データの可視化について
- EDA(Eploratory Data Analysis)の際、データの可視化が重要なツールになる

Image by Allison Horst
ggplot2について
Rには備え付けの関数、
plot()があるが、今回はtidyverseのggplot2パッケージを使うgg= “Grammar of Graphics”(画像の文法)- 「文法」が分かれば、(ほとんど)
どんな図でも作れる
- 「文法」が分かれば、(ほとんど)
ggplot2について
図の構造にはいくつか決まった要素がある
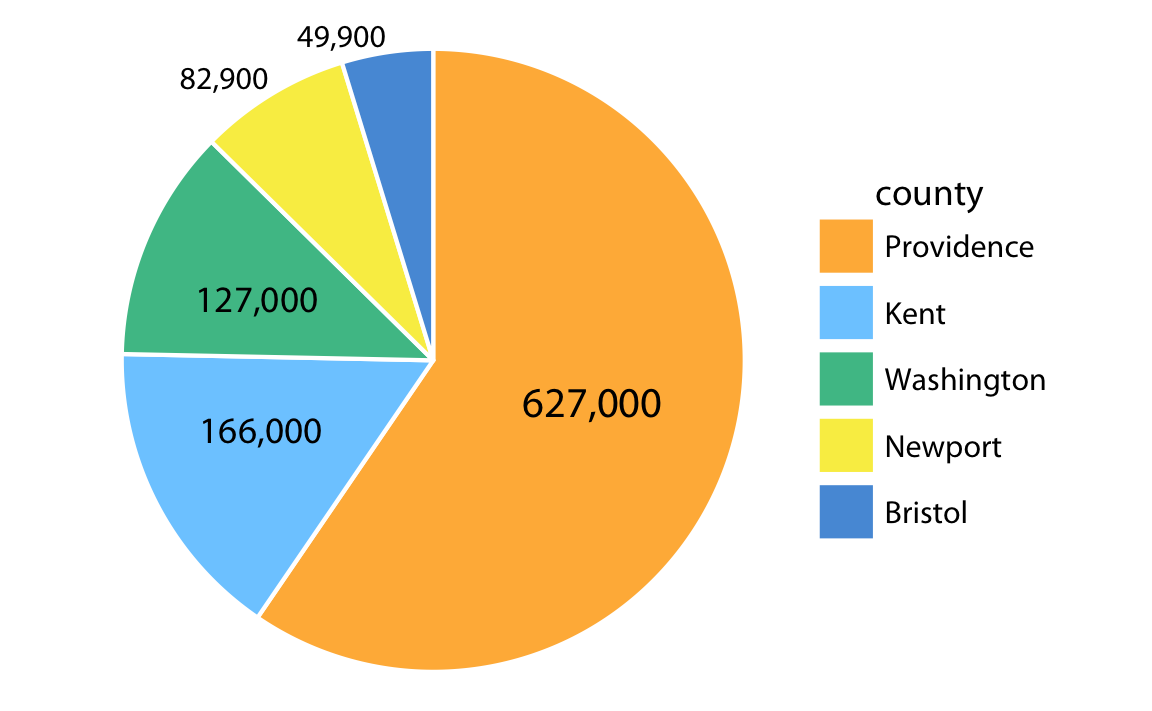
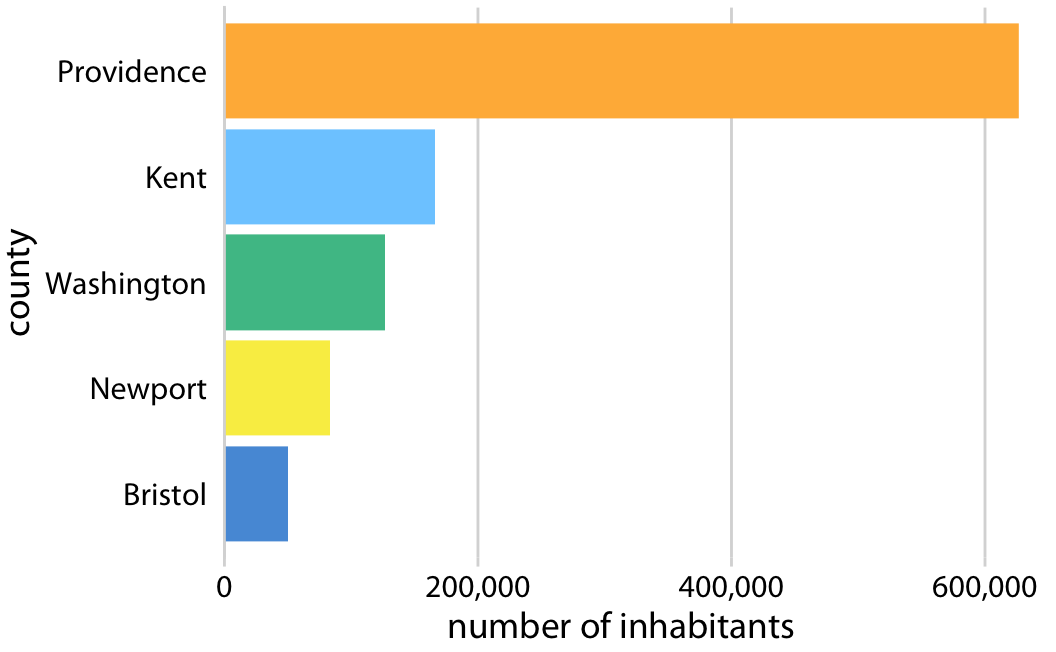
geometry: 図はどのような形にする?
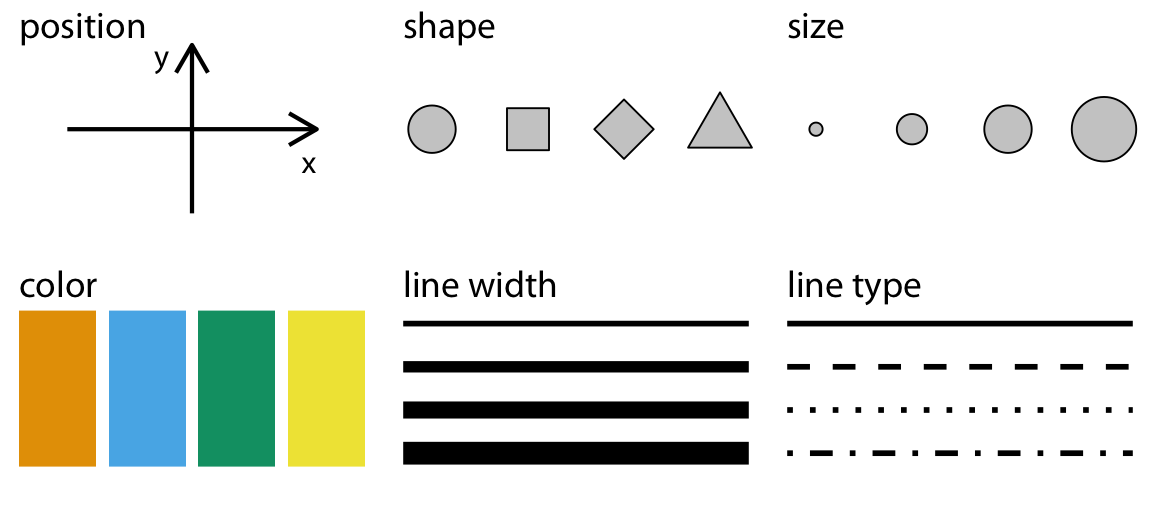
aesthetics: データをどのように図に表す?
Geometry
Pie chart

Bar graph

Aesthetics

palmerpenguinsについて
palmerpenguinsパッケージに入っている三種類のペンギンのデータ(体重、くちばしや翼の大きさなど)を含む

palmerpenguinsについて
# A tibble: 344 × 8
   species island    bill_length_mm bill_depth_mm flipper_length_mm
   <fct>   <fct>              <dbl>         <dbl>             <int>
 1 Adelie  Torgersen           39.1          18.7               181
 2 Adelie  Torgersen           39.5          17.4               186
 3 Adelie  Torgersen           40.3          18                 195
 4 Adelie  Torgersen           NA            NA                  NA
 5 Adelie  Torgersen           36.7          19.3               193
 6 Adelie  Torgersen           39.3          20.6               190
 7 Adelie  Torgersen           38.9          17.8               181
 8 Adelie  Torgersen           39.2          19.6               195
 9 Adelie  Torgersen           34.1          18.1               193
10 Adelie  Torgersen           42            20.2               190
# ℹ 334 more rows
# ℹ 3 more variables: body_mass_g <int>, sex <fct>, year <int>
palmerpenguinsについて
Rows: 344
Columns: 8
$ species           <fct> Adelie, Adelie, Adelie, Adelie, Adelie, Ad…
$ island            <fct> Torgersen, Torgersen, Torgersen, Torgersen…
$ bill_length_mm    <dbl> 39.1, 39.5, 40.3, NA, 36.7, 39.3, 38.9, 39…
$ bill_depth_mm     <dbl> 18.7, 17.4, 18.0, NA, 19.3, 20.6, 17.8, 19…
$ flipper_length_mm <int> 181, 186, 195, NA, 193, 190, 181, 195, 193…
$ body_mass_g       <int> 3750, 3800, 3250, NA, 3450, 3650, 3625, 46…
$ sex               <fct> male, female, female, NA, female, male, fe…
$ year              <int> 2007, 2007, 2007, 2007, 2007, 2007, 2007, …
palmerpenguinsについて

目的:このグラフを作る

ggplot()でグラフの基盤を作る
mapping()で座標を指定する
mapping()で座標を指定する
geom_()でデータの形を指定する
geom_()でデータの形を指定する
チャレンジ
bill_length_mmを横軸、bill_depth_mmを縦軸にして、点グラフを作成して下さい
colorで色を潰す
colorで色を潰す
geom_smooth()回帰直線を付け加える
geom_smooth()回帰直線を付け加える
目的の図と何か違う・・


aes設定はgeom_()の中でもできる
geom_smooth()とgeom_point()で指定したい要素を考えよう


colorをgeom_point()だけ指定しよう
チャレンジ:shapeで点の形を変える
aesの中でshapeを使うことによって、それぞれの種を点の形で表しましょう
labs()でラベルをきれいにする
ggplot(
  data = penguins,
  mapping = aes(x = flipper_length_mm, y = body_mass_g)
) +
  geom_point(mapping = aes(color = species, shape = species)) +
  geom_smooth(method = "lm") +
  labs(
    title = "Body mass and flipper length",
    subtitle = "Dimensions for Adelie, Chinstrap, and Gentoo Penguins",
    x = "Flipper length (mm)", y = "Body mass (g)",
    color = "Species", shape = "Species"
  )
labs()でラベルを整える
ggplot(
  data = penguins,
  mapping = aes(x = flipper_length_mm, y = body_mass_g)
) +
  geom_point(mapping = aes(color = species, shape = species)) +
  geom_smooth(method = "lm") +
  labs(
    title = "Body mass and flipper length",
    subtitle = "Dimensions for Adelie, Chinstrap, and Gentoo Penguins",
    x = "Flipper length (mm)", y = "Body mass (g)",
    color = "Species", shape = "Species"
  )
scale_colorで色を変える
ggplot(
  data = penguins,
  mapping = aes(x = flipper_length_mm, y = body_mass_g)
) +
  geom_point(mapping = aes(color = species, shape = species)) +
  geom_smooth(method = "lm") +
  labs(
    title = "Body mass and flipper length",
    subtitle = "Dimensions for Adelie, Chinstrap, and Gentoo Penguins",
    x = "Flipper length (mm)", y = "Body mass (g)",
    color = "Species", shape = "Species"
  ) +
  scale_color_colorblind()
よりもコンパクトな書き方
data =とmapping =を書かなくて良い
ggplot(penguins, aes(x = flipper_length_mm, y = body_mass_g)) +
  geom_point(aes(color = species, shape = species)) +
  geom_smooth(method = "lm") +
  labs(
    title = "Body mass and flipper length",
    subtitle = "Dimensions for Adelie, Chinstrap, and Gentoo Penguins",
    x = "Flipper length (mm)", y = "Body mass (g)",
    color = "Species", shape = "Species"
  ) +
  scale_color_colorblind()
base_familyで文字化けを防ぐ
ggplot(penguins, aes(x = flipper_length_mm, y = body_mass_g)) +
  geom_point(aes(color = species, shape = species)) +
  geom_smooth(method = "lm") +
  labs(
    title = "体重とフリッパーの長さ",
    subtitle = "アデリー、チンストラップ、ジェンツーのペンギンのサイズ",
    x = "フリッパーの長さ(mm)", y = "体重(g)",
    color = "種", shape = "種"
  ) +
  scale_color_colorblind() +
  theme_gray(base_family = "HiraKakuPro-W3")
まとめ
- どのデータやグラフでも、同じ「文法」で記述することができます。
- aesthetic mapping(
mappingとaes)、どのデータをグラフのどの要素で表示するかを設定する - geometry(
geom)は、グラフの形状を設定する - グラフを作成するコマンドは、レイヤーを
+で重ねていく


